






Skip to content
BI & Analytics · Chennai & Trichy

BI & data analytics company in Chennai & Trichy

Naryon Tech turns scattered data into clear decisions for businesses across Tamil Nadu and South India, Power BI dashboards, data warehousing and real-time analytics your team actually uses every day.

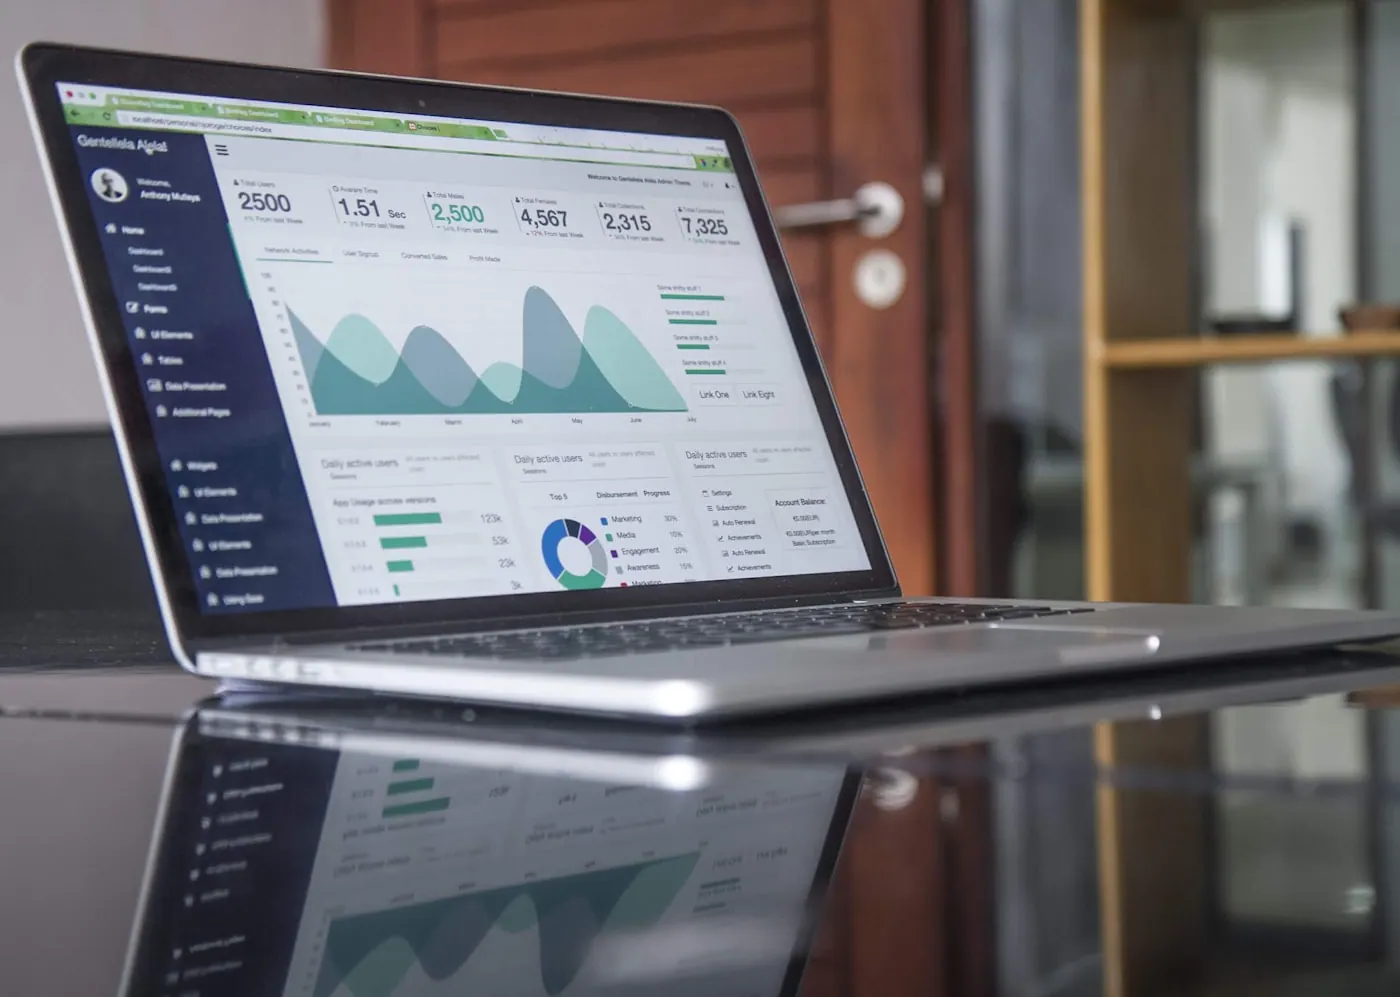
Business analytics dashboard on a laptop screen

Trusted by growth-focused brands

GECRelish FoodsZero213 Dots IT SolutionsGECRelish FoodsZero213 Dots IT SolutionsGECRelish FoodsZero213 Dots IT SolutionsGECRelish FoodsZero213 Dots IT Solutions
  • 15+ Data & BI projects delivered
  • 4.9/5 Average client rating
  • 2 Delivery hubs, Chennai & Trichy
  • 24/7 Support across South India

Business intelligence that people actually use

As a BI and data analytics company serving Chennai, Trichy and South India, we turn scattered data into a single, trusted source of truth, then build Power BI dashboards, data warehousing, ETL pipelines, predictive analytics and real-time reporting on top of it. The goal is simple: the right number, in the right place, at the right time.

We start from the decisions you need to make, not the charts. We audit your data honestly, model it properly and reconcile every figure, so your team trusts the dashboard and opens it every morning. Practical, governed, and built to grow with you.

Team analysing printed data charts at a desk
Business Intelligence

One trusted source of truth

When every team has its own spreadsheet, no one agrees on the numbers. We unify your data and build dashboards everyone can rely on.

  • Interactive Power BI, Looker and Tableau dashboards
  • A single source of truth from scattered data
  • Real-time analytics with alerts that matter
  • Reports your team acts on every morning
Talk to a data engineer
Industries & use cases

Analytics built for your sector

Where clear data creates real value across the industries we work with in Tamil Nadu and South India.

E-commerce & Retail

Sales, inventory and customer dashboards with demand forecasting, so buyers reorder on data, not gut feel.

Healthcare

Patient-flow, occupancy and compliance reporting that reduces admin and surfaces bottlenecks early.

Finance & Banking

Financial reporting, risk and regulatory dashboards with a clear, auditable trail.

Logistics & Supply Chain

Fleet, route and cost analytics that expose waste and improve on-time delivery.

Manufacturing

Production, quality and OEE dashboards on the shop floor, with alerts on downtime and defects.

SaaS & Startups

Product, funnel and revenue analytics that tie activation and retention to real growth levers.

Why choose Naryon Tech

A data partner built for decisions, not just charts

Senior Data Engineers

A compact, senior team that models data properly, no juniors learning on your project.

Business-First Modelling

We start from the decisions you need to make, then build the data to support them.

Governed & Secure Data

Access controls, quality checks and a trustworthy single source of truth.

Dashboards People Use

Clear, fast dashboards your team opens daily, not reports nobody reads.

What we build

BI capabilities your teams rely on

BI Dashboards

Interactive Power BI, Looker and Tableau dashboards of your key metrics.

Data Warehousing

A central, clean store that unifies data from every system.

Predictive Analytics

Forecast demand, churn and revenue from your own history.

Real-Time Analytics

Live data streams with alerts when something needs attention.

ETL & Data Integration

Reliable pipelines that combine and clean scattered sources.

Reporting & Visualization

Clear reports and visuals that communicate performance.

A closer look

What our analytics do, in practice

Business analytics dashboard on a laptop screen
BI Dashboards

Dashboards your whole team actually opens

We build interactive dashboards in Power BI, Looker or Tableau that show your real KPIs, filterable and fast. No more waiting on the data team for a one-off report, everyone sees the same trusted numbers.

  • Power BI, Looker & Tableau
  • Your real KPIs, one view
  • Drill-down & filters
  • Mobile and shareable
Cloud data-centre servers powering AI applications
Data Warehousing

One clean home for all your data

Sales, inventory, finance and marketing data usually live in separate silos. We build a central warehouse on BigQuery, Snowflake or Postgres that unifies them into a single, governed source of truth.

  • BigQuery, Snowflake, Postgres
  • Unifies every system
  • Governed & documented
  • Scales as you grow
Financial analytics and market data on a screen
Predictive Analytics

See what is coming, not just what happened

Beyond reporting the past, we build forecasting models on your own history, demand, churn, cash flow and risk, so you plan and act ahead of the curve instead of reacting to it.

  • Demand & revenue forecasting
  • Churn & risk scoring
  • Anomaly detection
  • Retrained as data grows
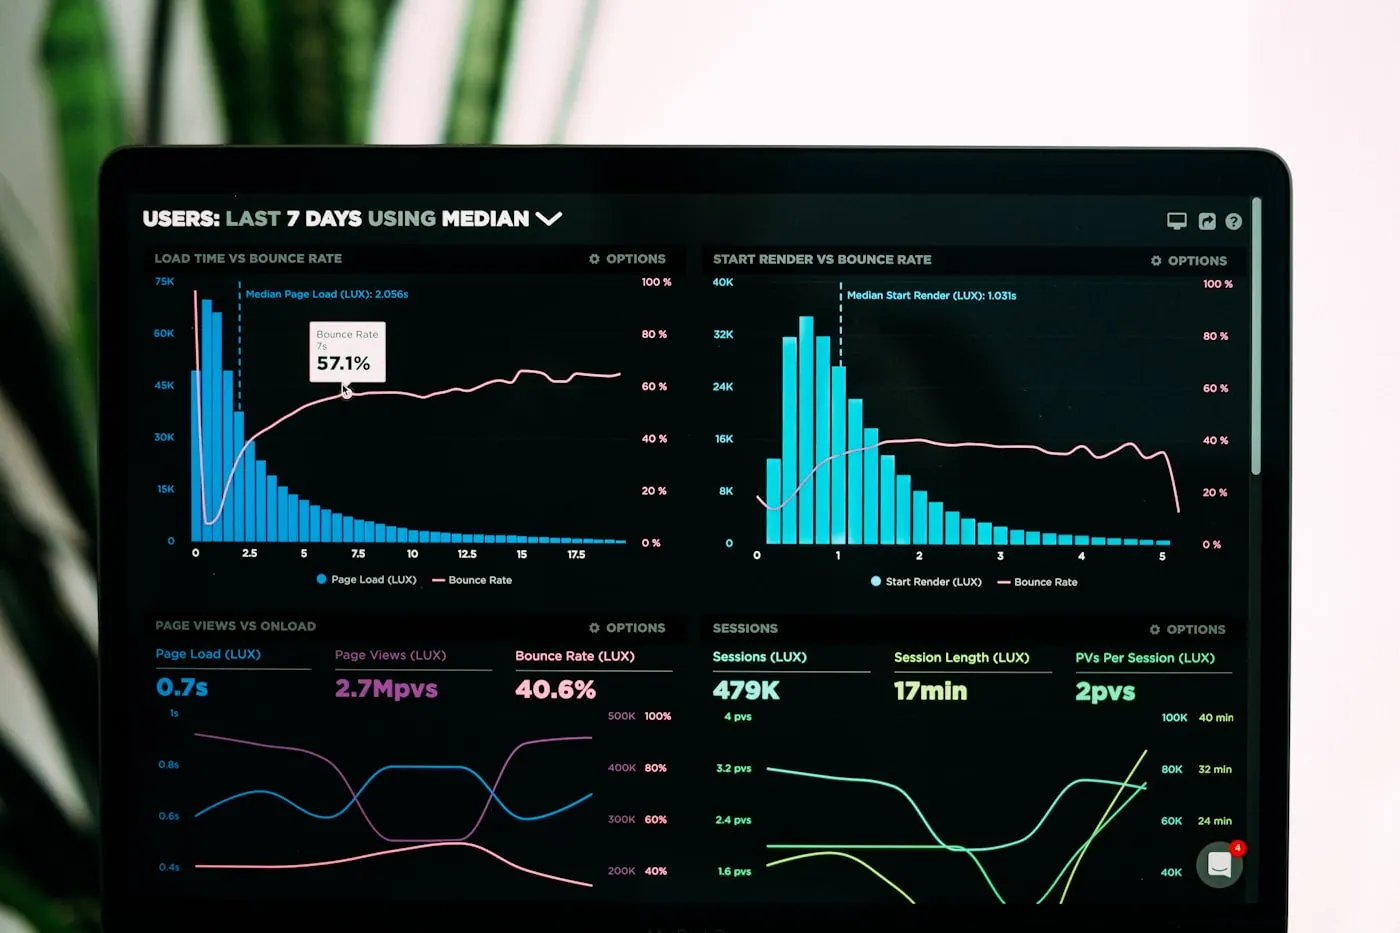
Data charts and graphs displayed on a laptop
Real-Time Analytics

Live data with alerts that matter

For operations that move fast, we stream live data into dashboards and set smart alerts, so a stock-out, an SLA breach or a spike reaches the right person the moment it happens, not next month.

  • Live streaming dashboards
  • Smart threshold alerts
  • Operations monitoring
  • Cloud or on-premise
The impact

What businesses gain from working with us

1 Single source of truth every team can trust
80% Fewer one-off report requests with self-serve BI
4 to 7 wks From scattered data to a live, trusted dashboard
24/7 Real-time alerts on the metrics that matter
Our process

How we deliver BI, step by step

01

Discovery & KPIs

We map the decisions you need and the metrics behind them.

02

Data Audit

We assess your sources, quality, volume and access.

03

Data Modelling

We design a clean, reliable model and a single source of truth.

04

Dashboard Design

We design clear, fast views around how your team works.

05

Build & ETL

We build the pipelines and dashboards and wire in your systems.

06

Validation

We reconcile the numbers so the team trusts every figure.

07

Deployment

We roll out with access controls and refresh schedules.

08

Support & Iterate

We maintain, add metrics and keep the data trustworthy.

Inside each step

How we deliver BI, explained

Exactly what happens at each stage, no black boxes, no surprises.

01 · Discovery & KPIs

A focused workshop to map the decisions you need to make and the exact metrics behind them, so we build dashboards around real questions, not vanity numbers.

02 · Data audit

We assess every source, its quality, volume and how to access it, and flag gaps early. You get an honest picture of what your data can and cannot answer today.

03 · Data modelling

We design a clean, well-documented model and a single source of truth, so the same metric means the same thing in every report.

04 · Dashboard design

We design clear, fast layouts around how your team actually works, the right chart for each question, no clutter.

05 · Build & ETL

We build the automated pipelines that combine and clean your sources, and the dashboards on top, wired into your live systems.

06 · Validation

We reconcile every figure against your source systems so the team trusts the numbers from day one. Trust is what makes BI get used.

07 · Deployment

We roll out with access controls, refresh schedules and clear ownership, on your cloud or ours.

08 · Support & iterate

We maintain the pipelines, add metrics as needs change and keep the data reliable as your business grows.

What to expect

Your first dashboard, week by week

  1. Week 1 Discovery & KPIs Decisions, metrics and a data-source audit.
  2. Weeks 2 to 3 Model & design Data model and dashboard layouts agreed.
  3. Weeks 4 to 6 Build & ETL Pipelines and dashboards built and connected.
  4. Week 7 Validate & launch Numbers reconciled, then a controlled go-live.
  5. Ongoing Support & grow Maintenance, new metrics and reliable refreshes.
Our expertise

Where our analytics make the biggest difference

Cloud data-centre servers powering AI applications

Single Source of Truth

One clean, governed data model everyone trusts, so meetings stop arguing about whose number is right.

Business analytics dashboard on a laptop screen

Self-Serve Analytics

Dashboards teams explore on their own, cutting the queue of one-off report requests to your data team.

Financial analytics and market data on a screen

Predictive Foresight

Models that anticipate demand, churn and risk so you plan ahead of the curve, not behind it.

BI & analytics services

A complete data & analytics toolkit

BI Dashboards

Interactive dashboards in Power BI, Looker or Tableau.

Data Warehousing

Central, clean stores on BigQuery, Snowflake or Postgres.

ETL & Data Pipelines

Automated pipelines that combine and clean your sources.

Predictive Analytics

Forecasting models for demand, churn and revenue.

Real-Time Analytics

Live streaming dashboards with smart alerts.

Reporting & Visualization

Clear, automated reports for every stakeholder.

Data Modelling

Well-designed models and a single source of truth.

Self-Serve BI

Governed self-service so teams answer their own questions.

Data Governance

Access control, quality checks and documentation.

Our data & BI stack

Proven tools, matched to your problem

BI & Visualization

  • Power BI
  • Looker Studio
  • Tableau
  • Metabase

Data Warehouse

  • BigQuery
  • Snowflake
  • PostgreSQL
  • Redshift

Pipelines & ETL

  • Airflow
  • dbt
  • Python
  • Fivetran

Cloud

  • AWS
  • Google Cloud
  • Azure
  • Docker
How to work with us

Engagement models that fit your stage

Best to start

Fixed-Scope Dashboard

One high-value dashboard, fixed price, a few weeks. Prove the value of trusted data before a wider rollout.

For scale

Dedicated Data Team

A senior, ring-fenced data team working as an extension of yours, month to month, for a full BI roadmap.

For existing stacks

BI Enablement

Already have Power BI or a warehouse? We fix the data model, pipelines and governance so it becomes reliable.

How we compare

Off-the-shelf tool vs agency vs Naryon Tech

Buying a generic tool or hiring a big-city agency both have trade-offs. Here is an honest side-by-side.

  SpreadsheetsGeneric BI toolNaryon Tech
Single source of truth No, every file differsOnly if modelledYes, governed model
Handles growing data Breaks at scaleSometimesWarehouse-backed
Automated, always current Manual updatesPartlyAutomated pipelines
Senior data engineers N/ADIYAlways senior
Local presence (Chennai/Trichy) N/ARarelyTrichy HQ + Chennai
Team actually adopts it Yes but riskyOften shelvedBuilt for daily use
Client results

Trusted by teams in Chennai & Trichy

“Every team used to bring a different number to the meeting. Naryon Tech built one dashboard we all trust, and decisions are faster now.”
Operations Head · Manufacturer, Chennai
“They understood our business before touching the data. The reorder dashboard alone paid for the project within a quarter.”
Founder · Retail chain, Trichy
Results, not promises

What our BI work looks like in the real world

Business analytics dashboard on a laptop screen
1source of truth

Unified reporting for a Chennai manufacturer

Five teams brought five different numbers to every review. We built one governed data model and a shared dashboard, so meetings now start from the same trusted figures and decisions move faster.


Data charts and graphs displayed on a laptop
−28%stock-outs

Reorder dashboard for a Coimbatore retailer

A demand-forecasting dashboard turned years of sales data into simple weekly reorder guidance, sharply cutting stock-outs on fast-moving lines within a quarter.

A data scientist analysing AI model results
Hours → minsmonthly reporting

Automated reporting for a finance team

A finance team spent days each month building board reports by hand. Automated pipelines and a live dashboard turned that into a few minutes, with numbers reconciled to source.

Service areas

BI & analytics across Chennai, Trichy & South India

Headquartered in Trichy with dedicated delivery for Chennai, we build and support BI and analytics for businesses across Tamil Nadu, local collaboration, production-grade engineering.

  • Chennai
  • Tiruchirappalli (Trichy)
  • Coimbatore
  • Madurai
  • Salem
  • Erode
  • Tirunelveli
  • Vellore
  • Tiruppur
  • Puducherry
Cybersecurity and data protection for AI systems
Data, security & trust

Your data stays yours, private and protected

Data is only useful if it is safe. We treat your data with the same care we would our own.

  • Encrypted in transit and at rest
  • Least-privilege access controls
  • Deployable inside your own cloud
  • NDA & data-processing agreement on request
  • Full ownership of code, models & IP transferred to you
Speak data with confidence

A plain-English BI glossary

No jargon walls. Here are the terms you'll hear during a BI project, explained simply.

Business Intelligence (BI)
Turning raw data into dashboards and reports that help people make better decisions.
Data Warehouse
A central, organised store that unifies data from many systems for fast analysis.
ETL (Extract, Transform, Load)
The pipeline that pulls data from sources, cleans it and loads it into your warehouse.
KPI (Key Performance Indicator)
A metric that measures progress toward a specific business goal.
Data Model
How your tables and metrics are structured so numbers stay consistent everywhere.
Self-Serve BI
Governed dashboards that let teams answer their own questions without waiting on a data team.
Clearing the air

Common myths about BI, and the reality

A lot of hesitation around BI comes from misconceptions. Here's an honest reset.

Myth

BI is only for big enterprises.

Reality

A single high-value dashboard is affordable for SMEs, and Trichy-based delivery keeps it competitive.

Myth

Our spreadsheets are good enough.

Reality

Spreadsheets break at scale and every copy differs. A warehouse gives one current, trusted source.

Myth

We need perfect data before starting.

Reality

We assess your data honestly and start with what you have, improving quality as we go.

Myth

Dashboards get built, then ignored.

Reality

That happens when numbers are not trusted. We reconcile every figure so teams rely on it daily.

Myth

BI and a fancy chart are the same thing.

Reality

A chart is output. BI is a governed model, reliable pipelines and metrics that mean the same thing everywhere.

FAQs

BI & analytics, answered

How much does a BI dashboard cost in Chennai or Trichy?

It depends on your data sources and the number of dashboards. After a short discovery call we give a clear, fixed-scope estimate, most businesses start with one high-value dashboard and expand.

How long does a BI project take?

A focused dashboard typically ships in 4 to 7 weeks. Larger warehouse projects are delivered in phases so you see value early.

Which BI tools do you work with?

Power BI, Looker Studio, Tableau and Metabase, connected to warehouses like BigQuery, Snowflake or Postgres, chosen to fit your needs.

Can you connect to our existing systems?

Yes, we build pipelines that pull from your ERP, CRM, accounting, spreadsheets and databases into one unified source.

Do you work with businesses outside Chennai and Trichy?

Yes, we are based in Trichy with delivery for Chennai, and serve Coimbatore, Madurai, Salem and the wider South India region.

What if our data is messy or scattered?

That is the normal starting point. We audit sources honestly, clean and model the data, and improve quality as part of the project.

Do you build a data warehouse too, or only dashboards?

Both. For scattered data we build a central warehouse first, so dashboards sit on one reliable source of truth.

Will our team be able to use it without us?

Yes, we design for self-serve and train your team, so they explore data and answer their own questions.

How do you make sure the numbers are correct?

We reconcile every figure against your source systems before launch. Trust in the numbers is what makes BI get used.

Is our data kept secure?

Yes, encrypted in transit and at rest, least-privilege access, and deployable in your own cloud. NDA and data-processing agreement on request.

Can you add predictive analytics later?

Yes, once your data is clean and centralised, forecasting and predictive models are a natural next step on the same foundation.

Do you offer real-time dashboards?

Yes, for fast-moving operations we stream live data and set smart alerts so issues reach the right person immediately.

Who owns the dashboards and pipelines?

You do, all data models, pipelines and dashboards are yours, documented and handed over on delivery.

Do you provide ongoing support?

Yes, we maintain pipelines, add metrics as your needs change and keep everything refreshing reliably.

Why choose a Trichy-based BI company over a metro agency?

Senior data engineering at a more competitive rate than metros, plus easier local collaboration and market understanding.

Have a data challenge? Let's solve it.

Book a free assessment, we'll tell you honestly what's feasible and what it takes.